Side project
Can I train a model to find an ancient civilization on Mars?
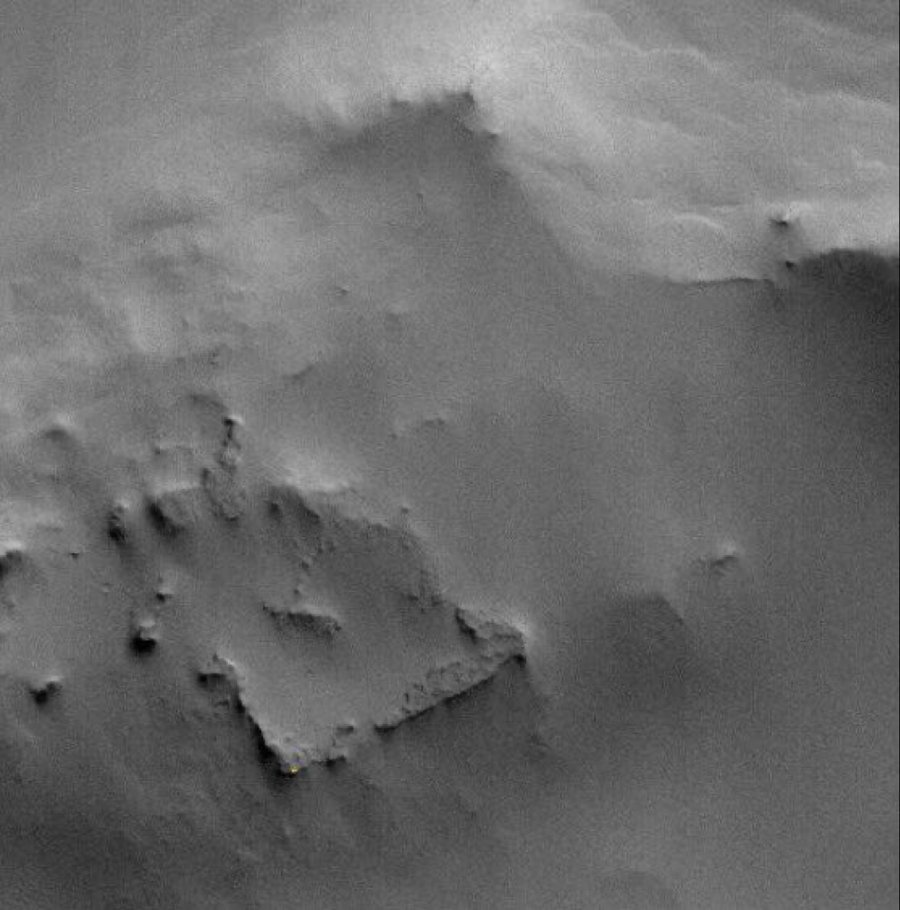
That's the shape that started this — photographed by Mars Global Surveyor. There's very probably a boring explanation. But it's exactly the kind of thing I wanted a machine to notice on its own.
Why I'm doing this
I've always liked the detective side of archaeology — the digging, the arguing over what a shape in the ground means, the possibility that someone was here before and left something behind. On Earth that requires permits and a shovel. Mars is the odd case where the digging has already been done: we have photographed essentially the entire planet, the images are free to anyone, and almost nobody has looked at most of them.
Here's my position. I think the probability of finding evidence of an ancient civilization on Mars is extremely low. I also think it isn't zero. When checking costs a few weekends and some cloud credits, "extremely low but not zero" is reason enough to go and look.
Nearly all of Mars is photographed at about 6 metres per pixel, and a few percent of it at 25 to 50 centimetres. Can computer vision sweep that library, flag the places whose geometry is hard to explain by wind, water or impacts, and hand back a short list worth a scientist's afternoon?
That's a search problem, not a belief. A search either finds something or lowers the odds for the ground it covered, and both are worth having. Right now nobody can tell you either way, which is the part I find hard to leave alone.
There's a second reason, and it isn't a small one. I wanted to know what these AI tools can actually do now — not in a demo, on a real problem with real data and no tidy answer at the end. The interesting measurement turned out to be speed. From "I wonder if you could do this" to a working scanner streaming NASA imagery, running validation experiments and handing me a scored shortlist took about two days. Not two days of my full attention, either. That number would have been months not long ago, and I don't think most people have updated for it yet.
And a third reason, which is really the first. I want my kids in on this. Not watching me work — actually doing the part that matters, which is looking at pictures of another planet and deciding which ones look strange. The machine hands back a hundred candidates and a human has to judge them. That's a job a curious eight-year-old can do, and it comes with the best lesson science has to offer: form an opinion, then let the evidence tell you you were wrong.
How it works, briefly
Nothing is stored in bulk. The HiRISE images live on USGS servers in Amazon's cloud, and the global CTX mosaic is served as map tiles; the scanner pulls only the pixels it needs for the patch it's currently measuring, at only the zoom level it needs. My laptop stores measurements, not photographs.
Mars gets cut into fixed cells — about 1.2 kilometres across for the wide sweep on the 6-metre mosaic, about 300 metres for close-up work on HiRISE. Every cell that gets scanned is logged, so the system can always tell me how much of the planet has been looked at and with which camera. If I close the lid, it picks up where it stopped.
For each cell it asks a handful of statistical questions. Do the edges here fall into two families about 90° apart, rather than one? Do long straight edges actually meet at corners? Are there parallel walls? And a question that subtracts rather than adds: is this just a dune field, where everything runs one way, which is organised but thoroughly ordinary?
Then, for the short list only, it spends real effort: it pulls the 3D terrain model if one exists, and it pulls other photographs of the same ground taken years apart with the sun in a different place. A shape that evaporates under different lighting was never a shape.
Three illusions it had to learn to ignore
The first version of this was useless, and it was useless in an instructive way. Each of its top "discoveries" turned out to be an artifact of how the pictures are made.
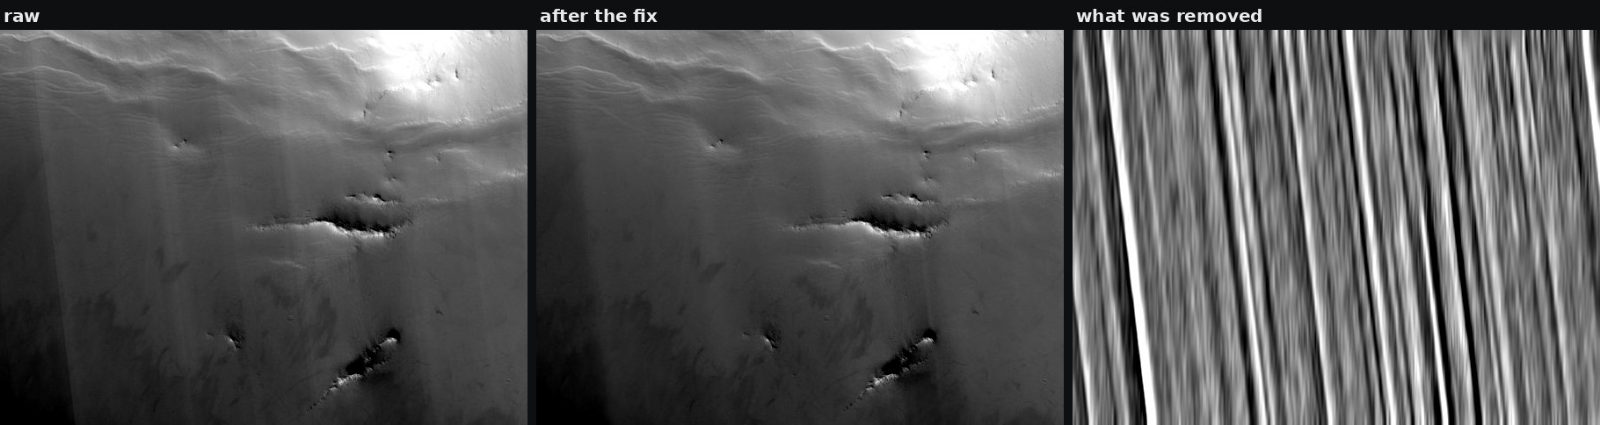
The camera's own stripes. HiRISE images carry faint streaks running along the spacecraft's flight path. They're long, perfectly straight, and they cross the natural rock layering at almost exactly 90°. To a right-angle detector, that's a jackpot. My first two candidates were both this.
The sun. When the sun is low, a slope facing it is bright and a slope facing away is dark, while anything running along the sun's direction barely registers. So every image arrives with a built-in preferred direction, and a naive detector reads that as alignment across the entire picture. The scanner now measures each cell against the direction pattern of the terrain around it, so it only scores when it disagrees with its neighbourhood.
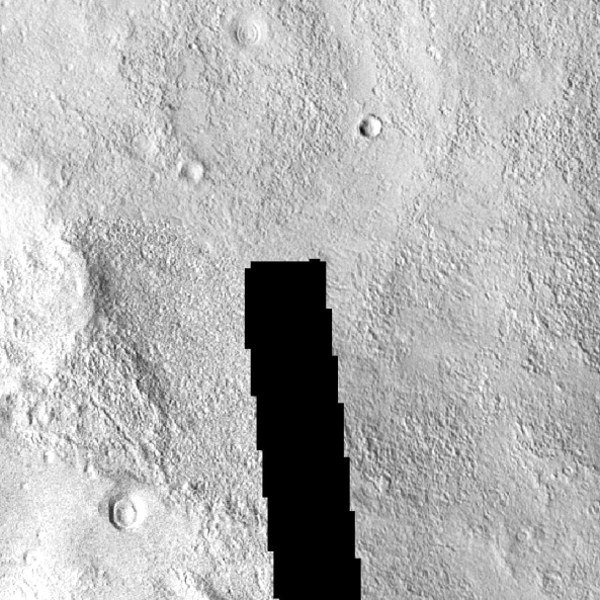
The seams. The global mosaic is stitched from about 110,000 separate photographs, and where they don't quite meet there's a wedge of near-black filler with a dead straight edge. Beautifully artificial. Entirely a filing artifact.
Proving it works, when there's nothing to test against
Here's the awkward part of this whole enterprise. There is no confirmed artificial structure on Mars, so there's nothing to check the detector against. You can't measure a hit rate with zero known hits.
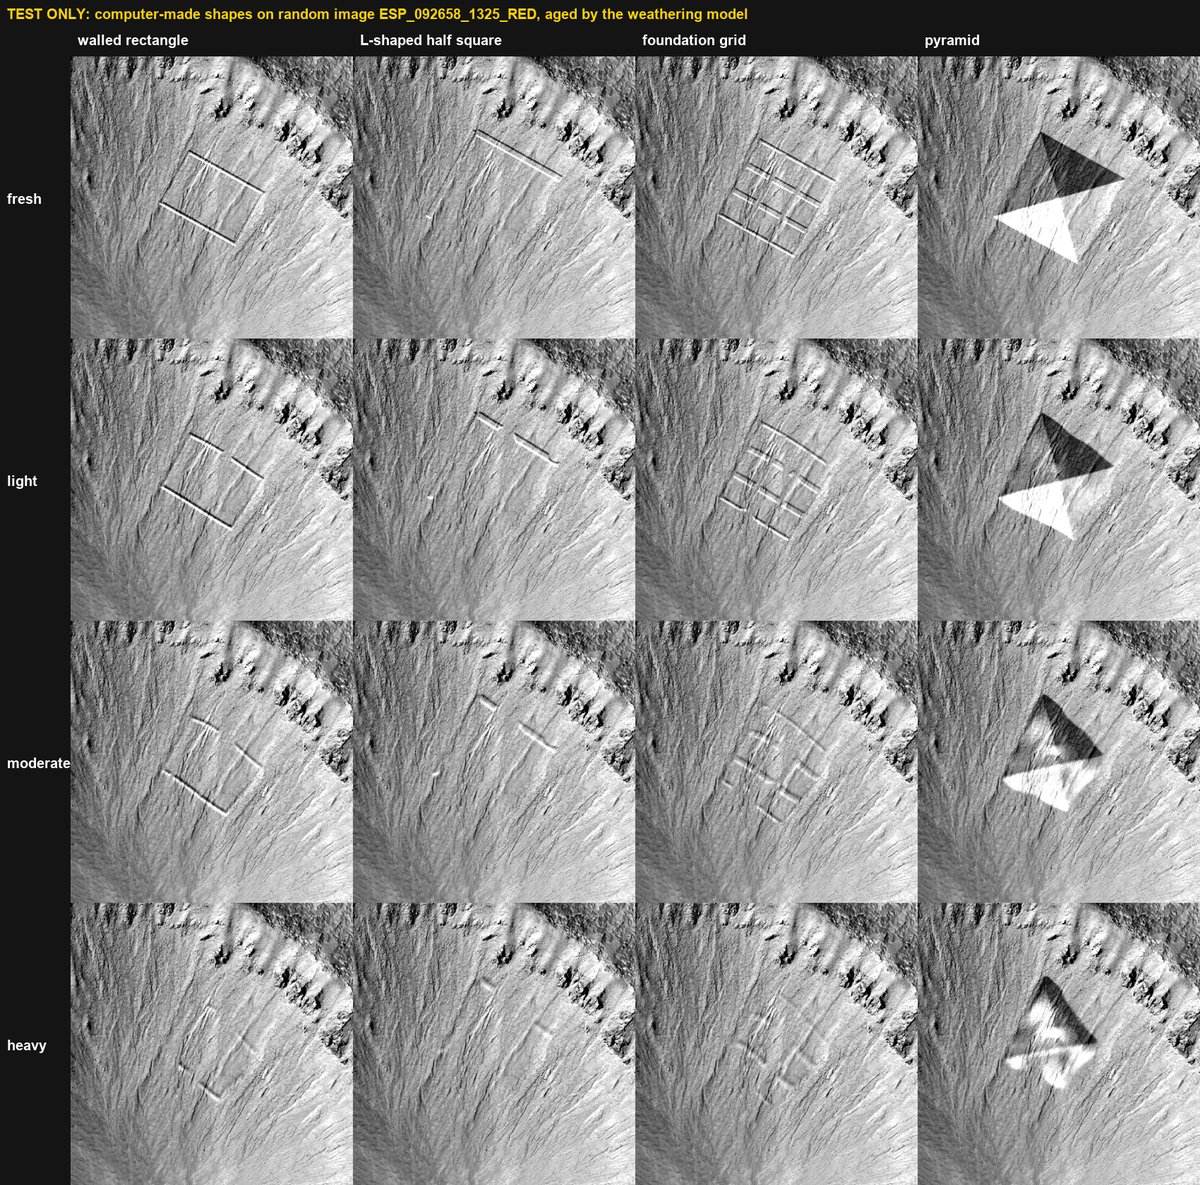
The way out is to plant things. I take real Mars imagery, paste a known structure into a copy in memory, and measure how highly it ranks against the ordinary cells around it. Walled rectangles, L-shaped corners, grids of foundations, pyramids.
Except that fresh, crisp shapes are a cheat. Anything actually out there has had a very long time to fall apart. So every planted shape gets weathered first: edges bend and wander, corners go off square by up to 12°, whole wall sections are missing, faces slump, one side gets half-buried in drift, and the entire thing is rounded off.
A planted shape covers several cells, so it gets credit for the best of them. Scored the same way — best cell out of a 3×3 patch — a random location with nothing planted still lands in the top 1% about 7% of the time. That, not 1%, is the bar to beat.
The first round of tests planted 75 shapes into 25 random HiRISE images and ranked each one against the roughly 1,300 ordinary cells of those images:
| Wear level | Reached top 1% | Reached top 5% | Ranked #1 |
|---|---|---|---|
| Light | 8 of 25 | 10 of 25 | 3 of 25 |
| Moderate | 6 of 25 | 11 of 25 | 3 of 25 |
| Heavy | 4 of 25 | 11 of 25 | 1 of 25 |
Against a 7% chance rate, light and moderate wear are clearly better than luck. Heavy wear, at 4 of 25, isn't — you'd see a result that good by chance about one time in eleven. For ruins that are badly worn down, this detector does no better than luck yet, and I'd rather say so than round it up.
Walls and grid layouts do well. Lone corners and pyramids do badly. The pyramid failure is worth stating plainly, because a pyramid is easy for a person to see from above — two faces lit, two in shadow. It just doesn't look like what the detector measures: four diagonal ridges meeting at a point, not walls meeting at corners. Only 1 of 18 planted pyramids made the top 1% from imagery alone.
So I ran the same experiment in three dimensions, planting pyramids into real elevation models and ranking them against 2,572 patches of natural terrain — hills, mesas, crater rims, ridges. There, 27 of 36 weathered pyramids landed in the top 1%, against a 3.3% chance baseline.
Which gives a clean division of labour: flat imagery finds walls and layouts, elevation data finds pyramids, and anything badly degraded needs both plus a second photograph taken under a different sun.
The test that matches what I actually reviewed
That first round has two gaps, and a careful reader will spot both. It used HiRISE images, but the regional sweep below ran on the 6-metre CTX mosaic. And "top 1%" of a whole region is thousands of cells; I only ever looked at the top 100. So I reran it on the real thing: 25 random blocks of the 6-metre CTX mosaic from Terra Sabaea itself, re-measured with today's code — about 2,400 ordinary cells — and 72 weathered shapes (walls, corners, grids and pyramids at 450, 900 and 1,800 metres) planted and ranked exactly the same way.
The answer is sobering. On the mosaic, 11 of 72 planted shapes reached the top 1% — 15% against a 7% chance rate, so the detector is picking something up, but not much. None of the 72 ranked first in its pool, and first out of 2,400 is the level that matches the list I actually reviewed (the top 100 of 192,000). Put plainly: if a weathered ruin with low walls sat in Terra Sabaea, the odds it made my top 100 were poor.
It isn't a broken test. As a control I planted fresh, six-metre-tall walls and grids into the same images, and 8 of 12 ranked first. The difference is height and wear. The walls I planted as "realistic" stand 1.5 to 5 metres, which at 6 metres per pixel is a pixel or two of shadow, and weathering blurs even that. So the 6-metre sweep is a coarse net: it catches big, tall, crisp things. Anything low or worn needs HiRISE, where the same detector does noticeably better.
As a sanity check I also ran two features people already argue about. The Cydonia "Face" came out 3rd of 529 cells in the test pool. The mound on Syrtis Major that HiRISE itself catalogues as "pyramidal" came 14th. Neither is evidence of anything — both have ordinary geological explanations — but a detector that shrugged at them would be suspect. It also tells me something less flattering: the Face is a mesa, so the detector likes mesas, and I then pointed it at a region full of them. That's a bias I have to watch.
The full breakdown, by shape, size and wear
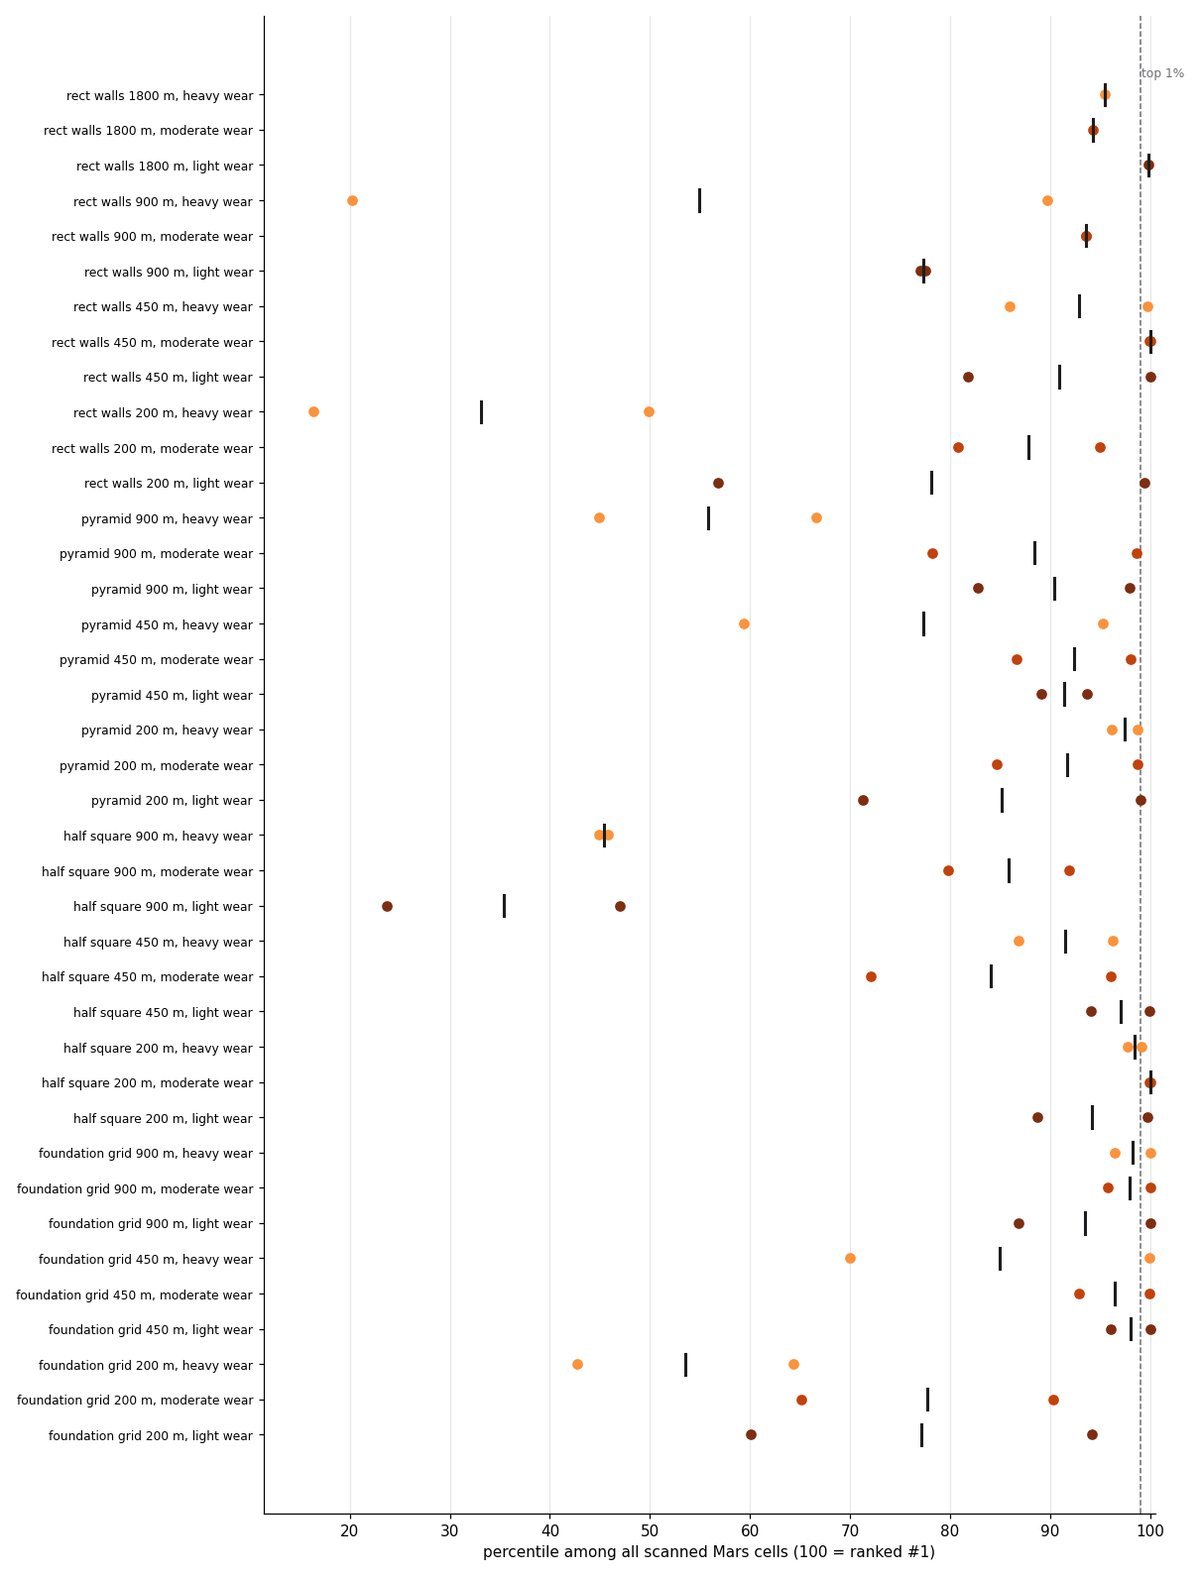
The chart above rolls everything up into three wear buckets. Here's every combination separately — each shape at each size and level of wear, shown as its percentile rank against every scanned cell (100 = ranked first):
Then I pointed it at 235,000 km² and looked at what came back
That's a region of Terra Sabaea, chosen because it's full of flat-topped mesas like the one that started this. (A smaller patch around Cydonia, about 17,600 km², was scanned separately for the sanity check above.) The system produced its top 100 and built them into a single page I could scroll through and score: interesting, maybe, or natural.
I scored all 100. Four interesting, eight maybe, eighty-eight natural.
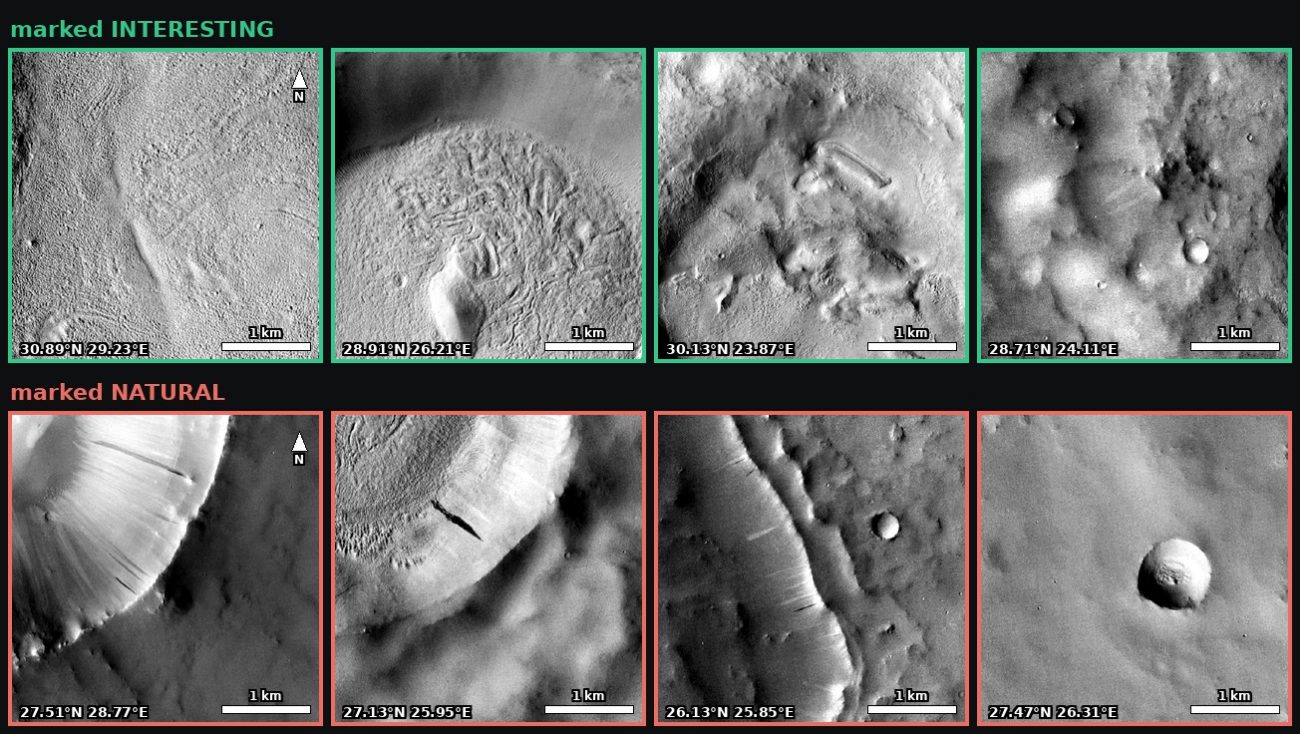
Eighty-eight rejections sounds like failure. It isn't, quite. Look at that bottom row and you'll see the pattern immediately: they're craters. And craters are a hard case, not a bug.
Dark streaks run straight down the inside of a crater wall — mostly slope streaks, small dust avalanches, with the odd gully. The rim and the rock layers run across them. Those two things meet at real right angles. A crater is not fooling my detector with a fake pattern — it is producing an authentic right-angle pattern with a completely ordinary cause.
I tried three different ways to reject craters automatically: voting for curvature in the edges, fitting circles to them, and testing whether the pattern radiates from a point rather than sitting on a grid. All three failed. None could separate a crater from a planted structure without also throwing away real ones. I've left that failure in the write-up rather than quietly deleting it, because it changed the design.
If a rule can't do it, the scoring has to learn it from a human. That's what my 88 rejections are for. The system now models what I reject and pushes anything similar down the list. Four "interesting" is far too few to learn what I'm looking for — but eighty-eight rejections is plenty to learn what bores me.
That has its own risk: a model trained on what bores me in one region could quietly bury something real that happens to sit on a crater wall. So every round, I also hand-check a random sample of what it pushed down.
The rest of the tuning so far has been less glamorous. Tiny scraps of rough texture, eight pixels long, were being counted as walls, so the minimum wall length now scales with pixel size: 150 metres on the 6-metre mosaic, 50 metres on HiRISE.
The one I keep coming back to
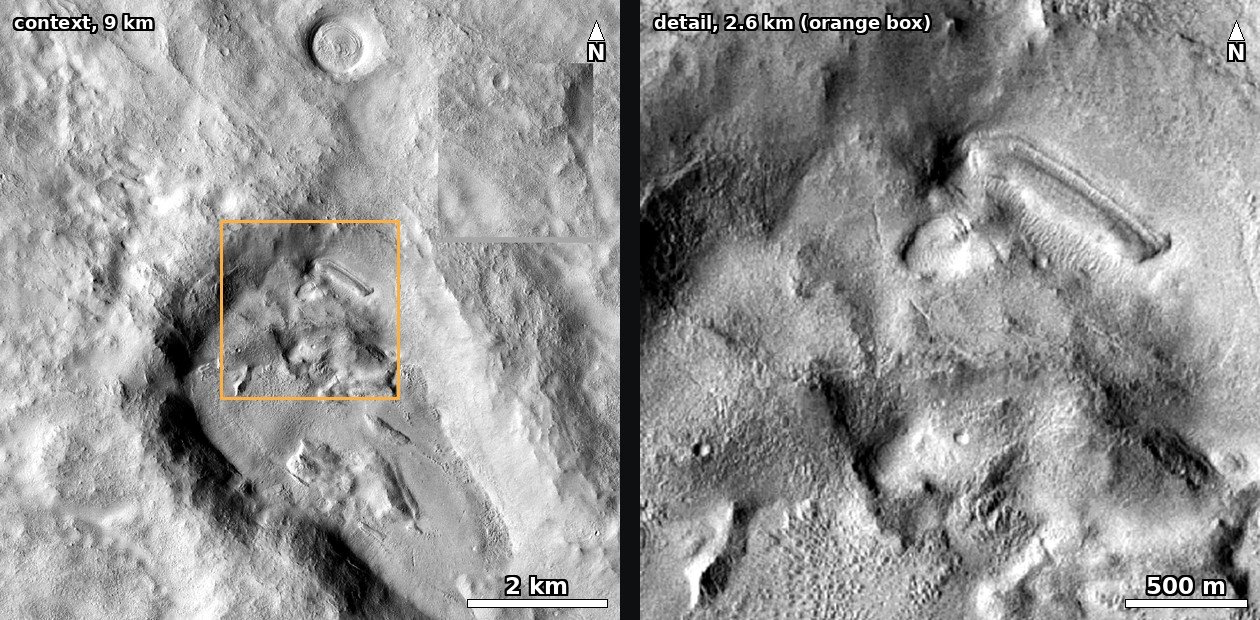
It's an elongated rim with a rounded end, about a kilometre long, sitting on the floor of an old crater. There are several ordinary ways to make something like this — an inverted channel, the edge of a debris lobe, a ridge along a buried fracture. What there isn't, yet, is a second look. No HiRISE image covers it, there's no terrain model, and no other photograph under a different sun. At 6 metres per pixel, that's as far as the evidence goes.
That's fixable: HiRISE takes public suggestions for where to point next through its HiWish programme, and this is going in as a request.
Where it stands
0.16% of Mars swept at 6 metres per pixel. One region. A hundred candidates scored by hand.
The close-up pass has finished too: all 136 HiRISE images covering the same region, at 1 metre per pixel — six times finer, which matters because the detector ignores any straight edge shorter than 150 metres on the 6-metre mosaic, and the small stuff is what I'm most curious about. That produced 115,417 cells of about 300 metres. I've scored its top 100 as well: six interesting, thirteen maybe, eighty-one natural.
Nothing found so far makes me reach for the phone. The most interesting thing to come out of it is a sharpened sense of how much geology looks designed when you sample enough of it. Which is its own kind of answer, and a good thing to be able to show the kids before we start scoring images together.
What's next, and what it would cost
Three things need doing before scaling up. Shadow measurement, so a wall can be distinguished from a dark stripe painted on the ground by its shadow length — which is the only practical way to get height for small features, since elevation models are too coarse. More scored candidates from me, so the learned side has something to work with. And a second region with different geology, so it isn't just learning one district's craters.
Then it's a question of raw compute. Here's the arithmetic, from measured scanning speeds (about 1,000–1,500 km² per minute per worker on the mosaic):
| Sweep the whole planet at 6 m/px | Time | Cost |
|---|---|---|
| My Mac Mini, four workers, running flat out | ~3–4 weeks | electricity |
| One 32-core cloud machine | ~4 days | ~$30–60 |
| Four of them in parallel | ~1 day | ~$30–60 |
The cost barely moves when you add machines, because you're buying core-hours either way. A day versus a month for the same money is not a difficult decision. Two things the table leaves out. The mosaic is currently read from a free public tile service, and a whole-planet sweep would pull several terabytes from it — not a fair use of a free service — so that run has to go against my own copy of the mosaic, which Caltech distributes freely. And the high-resolution pass over the full HiRISE archive, about 200,000 observations with a lot of overlap, is a much bigger job: roughly a month on one cloud machine for $200–400, or the better part of half a year on the Mac Mini.
What's holding me back from spending it isn't the money. It's that a faster scanner at today's precision just generates a longer list of craters. Speed multiplies whatever the detector is worth, so the detector has to be worth something first — and on the 6-metre mosaic, the test above says it isn't yet.
The code, the validation experiments and the raw numbers are all sitting in a folder on my desk. If you work on planetary imaging and want to tell me what I've got wrong, I'd like to hear it.
Image credits: HiRISE — NASA/JPL/University of Arizona. CTX and MOC — NASA/JPL/Malin Space Science Systems. Global CTX mosaic — Caltech Murray Lab (Dickson et al.). Elevation models — USGS Astrogeology.